This is the second instalment of a series of articles (read the first article here) examining the so-called “productivity puzzle”, specifically as it applies to public services. But before we dig into the concept of ‘productivity’ and how it applies in public services, we need to have a clearer picture of the public sector.
This is important because, in my opinion, one of the weaknesses in current discussions is treating the public sector as if it is a homogenous block. There are very important differences between different types of ‘public work’.
And the productivity of the public sector is, in some ways, tied to the productivity of other sectors. But we’ll come to that in more detail in a future article.
What is the public sector and public work?
Official statistics have evolved to make a seemingly crisp distinction between public and private sectors. Financial and workforce measures
But public spending to produce public goods and services often now flows through private and ‘third’ sectors as well as the public sector. In some areas this has always been true – such as large-scale construction of things like buildings and roads. But in the late 20th century it increasingly became true of other services.
So, for example, most domiciliary care for adults is now provided by private or third sector providers, but largely funded by public money. This means the care organisations and their staff are counted in official statistics as ‘private sector’.
This impacts discussions of the productivity of public spending because it is the productivity of these private and third sector organisations and staff that needs to improve. These issues are rarely addressed in discussions of public sector productivity.
The nature of public sector work
But let’s look at the organisations and activities that are undoubtedly public sector. And let’s examine three ways of breaking down the public sector using different ‘lenses’.
By economic category
The size of public spending is obviously an important indicator of the economic importance of the public sector as a whole and of its component parts.
In internationally agreed rules for national accounting, public expenditures are disaggregated according to the “Classification of the Functions of Government” (COFOG), which divides expenditures into ten functions:
Table 1 UK Spending by Function of Government
| Functions of government |
UK spending as % GDP 2021 |
Function as % of UK spending
|
| Social protection |
15.8
|
34.2 |
| Health |
9.0 |
19.5 |
| Economic affairs |
5.7 |
12.3 |
| Education |
5.1 |
11.0 |
| General public services |
4.7 |
10.2 |
| Defence |
2.2 |
4.8 |
|
Public order and safety
|
1.8 |
3.9 |
|
Housing and community amenities
|
0.7 |
1.5 |
|
Recreation, culture and religion
|
0.7 |
1.5 |
|
Environmental protection
|
0.5 |
1.1 |
Source: OECD Government at a Glance 2023
We will leave aside ‘social protection’ for a moment because, as will be explained below, this category of spending is complicated.
But it is worth noting that health and education account for more than 30% of public sector spending. The uniformed services (defence and policing) account for another 8.7%
So let’s look at the resulting patterns of public sector employment from this spending distribution?
By employment, by industry
Different public services differ in a number of ways that affect their productivity characteristics. The most important is obviously how capital vs labour intensive they are.
But before we discuss that we need to look at the ‘social protection’ economic sector to explain its employment. Categories for public sector employment do not mirror the standard economic categories for public spending.
So ‘social protection’ employment actually consists of two distinct types of employment: the first is actual social care workers providing ‘human services’ to citizens. There is a further complication here because many of these workers are technically employed in the private sector, although much of the spending that funds them comes from the public sector.
Table 2 Public Employment by Industry
| Industry |
Thousands |
% |
| NHS |
1,982 |
33.6 |
| Education |
1,508 |
25.6 |
|
Public administration (non-civil service)
|
652 |
11.1 |
|
Other (including financial corporations)
|
552 |
9.4 |
| Civil service |
529 |
9.0 |
| Police |
280 |
4.7 |
| Other health and social work |
210 |
3.6 |
| HM forces |
150 |
2.5 |
| Construction |
34 |
0.6 |
| TOTAL |
5,897 |
|
Source: Statista based on ONS data 2023
So although the ‘other health and social care’ public sector workers account for 210,000 workers there are actually about 1.8 million care workers in the UK. Which makes ‘social care’ employment sector probably the second largest category of employment funded by public expenditure.
The second type of ‘social protection’ public employees are those administrative workers employed in processing transfer payments to those receiving financial ‘social protection’ (benefits and pensions). The Department of Work and Pensions – where most of these staff work – currently has about 88,000 staff.
But in public spending terms the benefits and pensions DWP workers process probably account for around half of all ‘social protection’ spending, or around 17% of all public spending.
By the nature of public work
What sort of work do public servants do and therefore what sort of organisation structures and productivity possibilities flow from that?
When we did a project some years ago comparing four public functions (prisons, benefits, forestry and meteorological services) in four countries (the UK, Finland, Netherlands and Sweden) one of the things that stood out was that the specific task being carried out had a huge influence on the nature of the organisations and work-processes the closer you got to the ‘front-line’.
This is important because the nature of work is largely task-dependent (Pollitt, Talbot et al) and – crucially – the nature of the task and work affects the possibilities for productivity improvement and its nature substantially.
The range and diversity of task-types in the public sector is enormous and no categorisation system is going to capture them all. But a possible list might include:
Human services
- Human services (education, health, social care)
Administrative services
- Bureau services (tax, benefits, ID, etc)
Enforcement services
- Security services (defence & intelligence)
- Enforcement services (police, prison, probation, courts)
Physical services
- Physical services (building, roads, transport, utilities, environmental protection, posts and telecoms)
Knowledge services
- Policy services (classical ‘public admin’ - the machinery of government itself)
- Economic services (planning, advice, co-ordination, subsidies)
- Regulatory services (regulators, inspectors)
- Knowledge services (research - social, economic, scientific, medical, etc)
Based on available data my best guesstimate to the relative sizes of each of these service-types is in the pie-chart below.
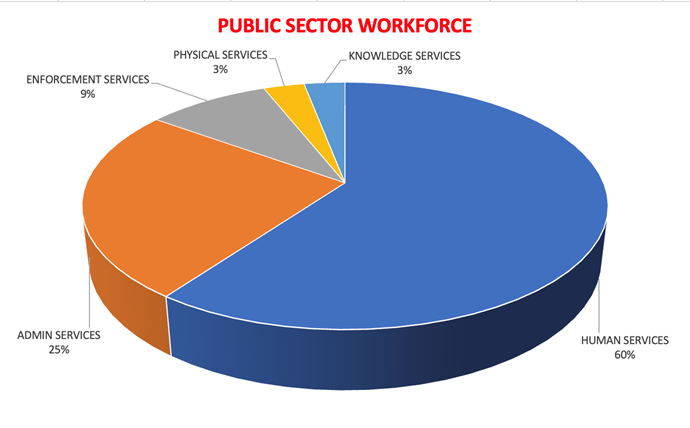
Why does this matter? Because how productivity can be improved in each of these types of services differs enormously.
Just take the first two - human services and administrative services – which combined account for maybe 85% of the public workforce. The dynamics of productivity are very different in, say, a tax office and a hospital. In the first the application of information technology can make a huge difference in processing taxes – because processing information is the core task. But in a hospital the possible impact of IT is much more limited. IT is a support function to the main tasks of diagnosing, treating and looking after patients.
We’ll look at this in much greater detail in future articles.
REFERENCES: Christopher Pollitt, Colin Talbot et al (2004) Agencies: How Governments Do Things Through Semi-Autonomous Organizations. Palgrave.
Colin Talbot is emeritus professor of government at the University of Manchester and a research associate at the University of Cambridge