More people left and joined the civil service than last year than any other in the last decade. Here is the civil service at a glance.
The civil service is always changing, adapting and transforming itself. In a year where more people left and joined than any in other in the last decade, that is as true as ever. The latest statistics, released this summer, show the makeup of the civil service as of March and how it has changed over recent years.
The civil service has grown each year since 2016, when the UK voted to leave the EU, and is now the biggest it has been since 2010. In May this year, Boris Johnson’s government said it wanted to bring the headcount back down to 2016 levels – by cutting around 91,000 jobs – by 2025. Rishi Sunak has since dropped that target, but cuts are expected as he asks departments to find efficiencies in their budgets.
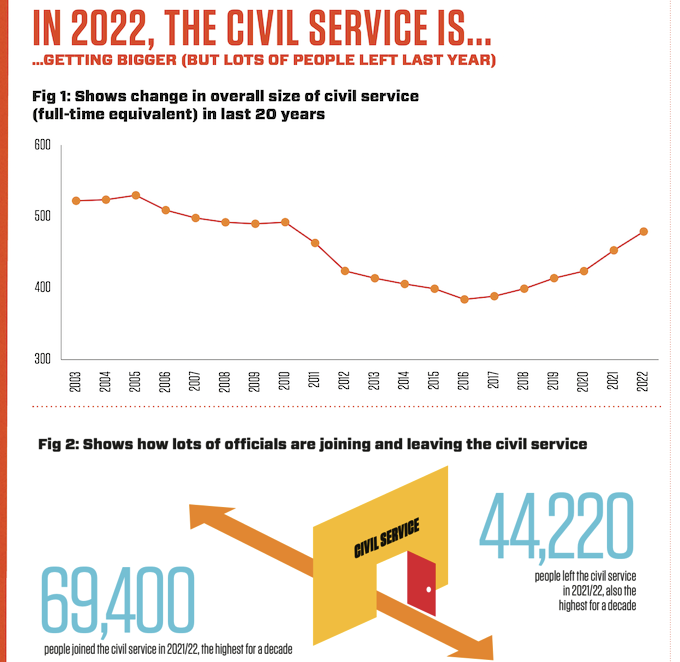
A huge 69,400 officials joined the civil service last year, while 44,220 left, with both figures the highest in a decade. The high join rate is partly due to 7,000 Community Rehabilitation Company staff being transferred to HM Prison and Probation Service as part of the renationalisation of privatised probation services.
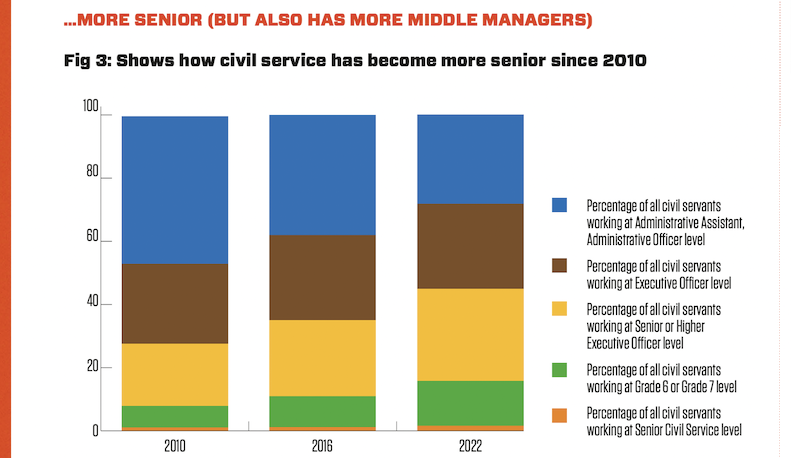
The portion of administrative officials has dropped dramatically, losing their decade-long status as the civil service’s most common grade. All other grades have grown, with higher and senior executive officers now the most common. The cohort working at grade 6/7 has grown the most, more than doubling since 2010.
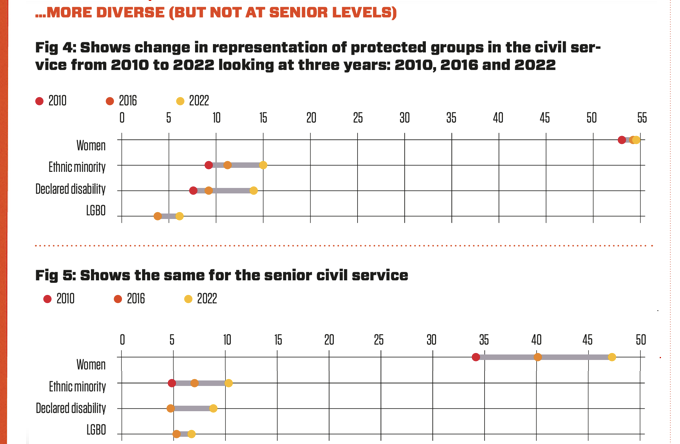
Representation of women; those from ethnic minority backgrounds; those declaring a disability; and those who are lesbian, gay, bisexual or other (LGBO) continues to grow. There are more women than men working in the civil service, similar to the general population split. Men still outnumber women for senior posts but the gap has shrunk hugely since 2010. The civil service has had a higher percentage of employees from ethnic backgrounds than the national working average in both 2021 and 2022, having lagged behind in the previous decade. There were no official statistics for sexuality in the civil service workforce until 2015 but since then the portion reporting their sexuality and declaring as LGBO has risen every year. Senior civil servants are more likely to call themselves LGBO and more likely to declare their sexuality.
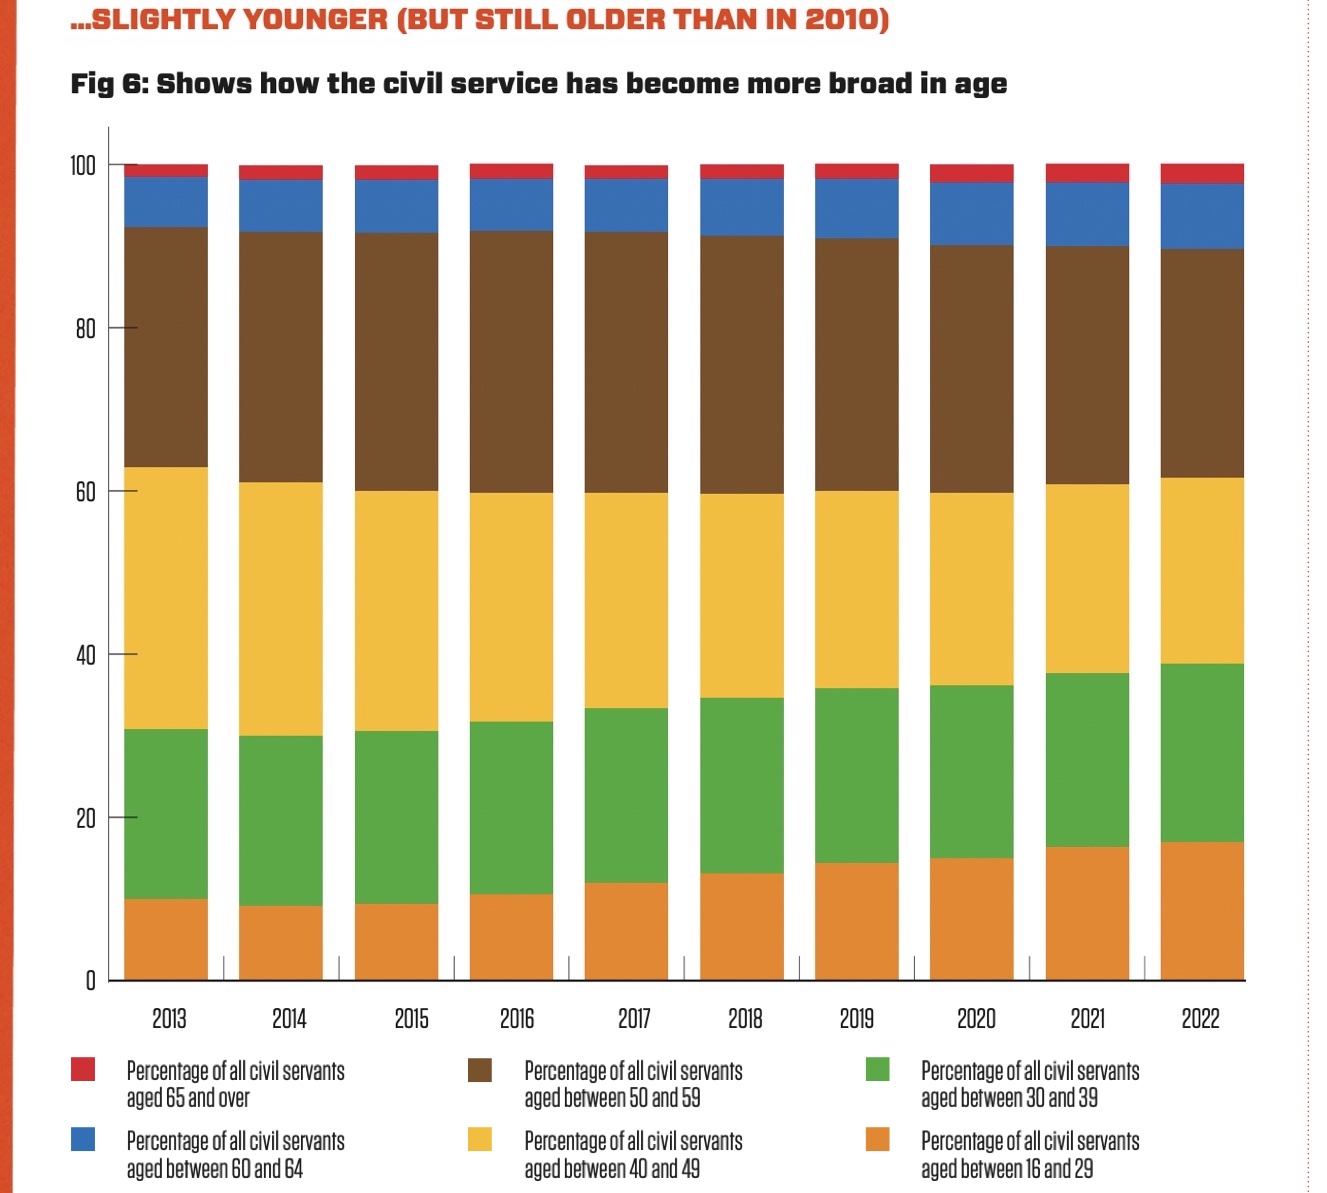
The median civil servant is aged 44 (down from 46 in 2020 and 47 in 2017). Despite this, there is a much lower portion of official in their 40s than a decade ago, when they made up almost a third of civil servants. The 50s age group is now the biggest, despite its own share of civil servants dropping. The 65+ and under-30s age groups have seen the biggest growth.
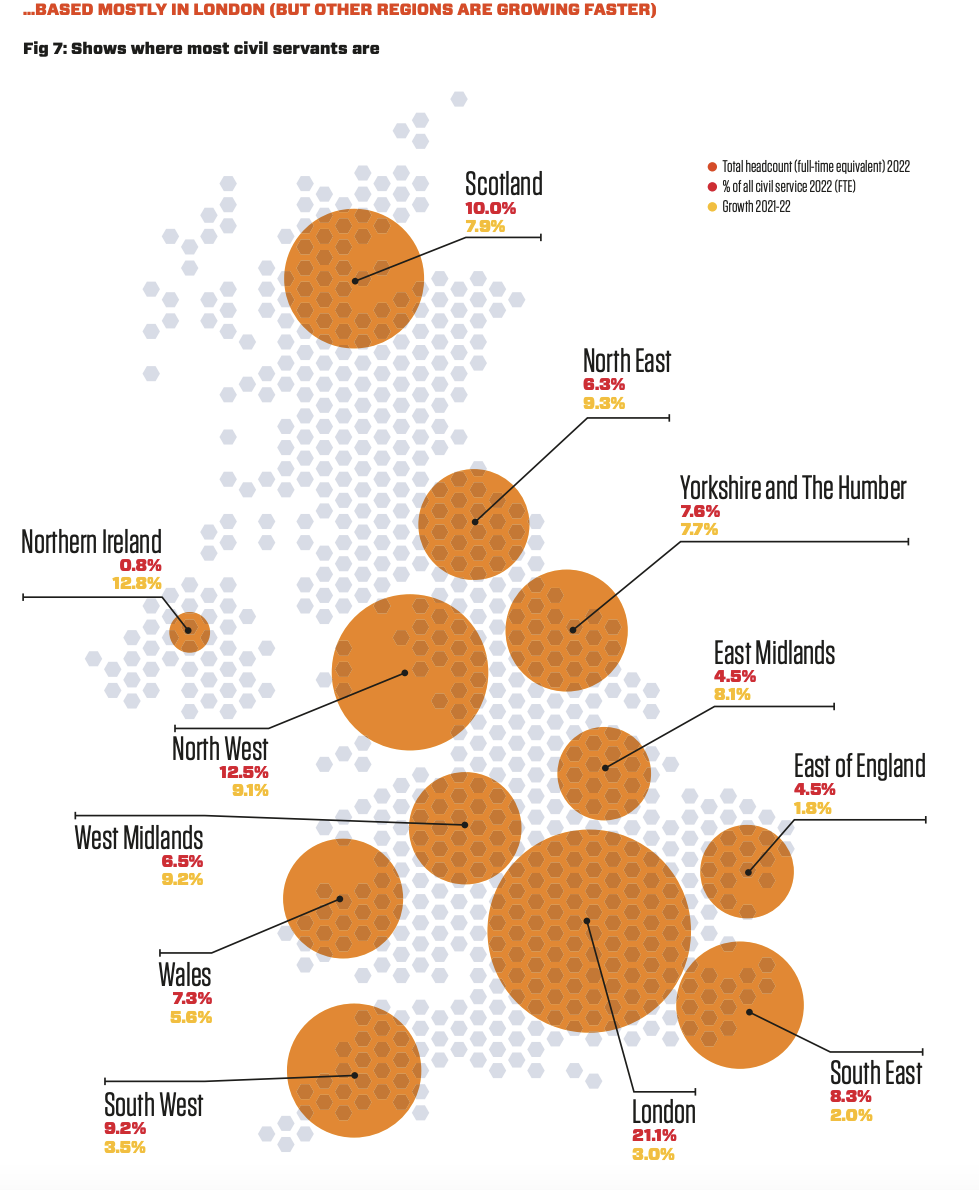
There are still many more civil servants in London than in any other region but some areas are closing the gap.